
The design of the surface facilities largely depends on the reservoir fluid characteristics. The reservoir fluid behavior is represented using a phase diagram which determines whether the fluid is oil or gas.
PHASE DIAGRAM
The generalized phase diagram below shows the relation between the major classes of hydrocarbon reservoir fluids in terms:
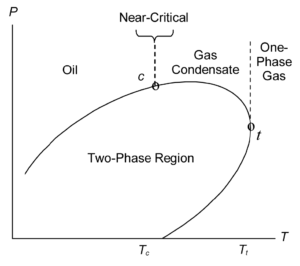
Although the shape of the phase diagram is specific to the actual fluid composition, it is the reservoir temperature compared to the temperature Tc of the critical point (Tc determines if the fluid is an oil or a gas). Numerous correlations are available for estimating reservoir-fluid type and condition from produced-fluid flow rates and properties measured at the wellsite (such as those developed by Standing), but you should be careful in using these methods, especially when the fluid properties differ significantly from those used to develop the correlation. For this reason, it is good practice to allow for significant error in the reservoir-fluid character when designing and implementing sampling programs.
The following table provides the interpretation of the generalized phase diagram:-
| Conditions | Interpretation (Refer to Diagram above) |
|---|---|
| Reservoir Temperature < Critical Temperature (Tc) | The fluid is an oil and will exhibit bubble point when the pressure of the fluid is reduced in to the two phase region. |
| Reservoir Temperature > Critical Temperature (Tc) | The fluid is gas and will show gas / condensate behavior and a dewpoint on pressure reduction |
| Reservoir Temperature > Cricondentherm Temperature (Tt) | The fluid will behave as a one phase gas with no liquid formation in the reservoir on pressure reduction. |
| Reservoir Temperature = or near to Critical Temperature (Tc) | The fluid is classified as critical or near critical fluid. These fluids neither bubblepoint nor dewpoint, but on pressure reduction in to the two phase region, they form system comprising large portions of both gas and liquid (60 % gas and 40% liquid by volume) |
| Reservoir Pressure is at the boundary of the two phase region | Referred to as Saturated, will immediately enter the two phase region when a well produces fluid because of the reduction of pressure in the well and near well bore region. |
| Reservoir Pressure is above the two phase region | Referred to as Unsaturated, |
RESERVOIR FLUIDS
The petroleum reservoirs are classified into five fluid categories viz., Dry Gas, Wet Gas, Gas Condensate, Volatile Oil and Black oil. Water is generally found in all reservoirs.
Dry and Wet Gas
The dry gas, wet gas and gas condensate are gas reservoir fluid types which are in gaseous state as the critical temperature of the reservoir fluid is less than the reservoir temperature. The dry and wet gas fluids consists mainly of light and intermediate hydrocarbons (Nitrogen, CO2, H2S and C1 to C2) in which no liquids will condense in the reservoir rock during pressure depletion. Wet gases produce high API condensate at surface conditions. Wet gases produce high API condensate (distillate) at surface conditions in amounts usually less than about 5 STB/MMSCF. The OGR in general remains constant throughout the depletion of a wet gas reservoir.
Gas Condensates
Gas condensates, in contrast, contain significant amounts of C5+ components, as pressure decreases (down to about 2000 psia), increasing amounts of liquid condense in the reservoir. This results in a significant loss of in situ condensate reserves that may only be partially recovered. Gas condensate reservoirs exhibit producing gas-oil ratios from 2500 to 50,000 SCF/STB (400 to 10 STB/MMSCF).
Volatile and Black Oil
Reservoir oils are classified as either black oil or volatile oil, the former being more commonly discovered in the first 50 years of the oil industry. Volatile oil reservoirs have become the norm in the past 20 years, mainly because discoveries are at greater depths with higher initial pressures. A gas-oil ratio of about 750 SCF/STB is probably a good indicator (black oils have lower GORs). Volatile oils may have GORs up to 2500 SCF/STB and formation volume factors as large as three (meaning that the oil shrinks by a factor of three when produced to the surface). Another characteristic of volatile oil reservoirs is that the reservoir gas that evolves and flows into the wellbore will contain significant quantities of liquids that may eventually contribute the majority of surface oil production at late stages of depletion.
Reservoir Water
The water generally found in all petroleum reservoirs is usually brine consisting mostly of sodium chloride (NaCl) in quantities from 10 to 350 ppt (‰); seawater has about 35 ppt. Other compounds (electrolytes) found in reservoir brines include calcium (Ca), magnesium (Mg), sulfate (SO4), bicarbonate (HCO3), iodide (I), and bromide (Br). Brine specific gravity increases with salinity in units of about 0.075 per 100 ppt. At reservoir conditions, the brine that is sharing pore space with hydrocarbons always contains a limited amount of solution gas (mainly methane), from about 10 SCF/STB at 1000 psia to about 35 SCF/STB at 10,000 psia for gas-water systems and slightly less for oil-water systems. Increasing salinity decreases gas in solution. The reservoir brines exhibit only slight shrinkage (<5%) when produced to the surface.
The following table provides a typical composition (in mol%) of the several reservoir fluids.
| Component or Property | Dry Gas | Wet Gas | Condensate | Volatile Oil | Black Oil |
|---|---|---|---|---|---|
| CO2 | 0.1 | 1.41 | 2.37 | 1.82 | 0.02 |
| N2 | 2.07 | 0.25 | 0.31 | 0.24 | 0.34 |
| C1 | 86.12 | 92.46 | 73.19 | 57.6 | 34.62 |
| C2 | 5.91 | 3.18 | 7.8 | 7.35 | 4.11 |
| C3 | 3.58 | 1.01 | 3.55 | 4.21 | 1.01 |
| i C4 | 1.72 | 0.28 | 0.71 | 0.74 | 0.76 |
| n C4 | — | 0.24 | 1.45 | 2.07 | 0.49 |
| i C5 | 0.5 | 0.13 | 0.64 | 0.53 | 0.43 |
| n C5 | — | 0.08 | 0.68 | 0.95 | 0.21 |
| C6s | — | 0.14 | 1.09 | 1.92 | 1.16 |
| C7+ | — | 0.82 | 8.21 | 22.57 | 56.4 |
| GOR (SCF/STB) | ∞ | 69,000 | 5965 | 1465 | 320 |
| OGR (STB/MMSCF) | 0 | 15 | 165 | 680 | 3125 |
Pressure-Volume-Temperature (PVT) Fluid Properties
Relatively accurate correlations are available for estimating the key fluid properties of reservoir systems; Equations of state (EOS) are now commonly used to calculate phase and volumetric behavior of reservoir mixtures. In particular, EOS are useful for predicting phase behavior of miscible and immiscible displacement processes resulting from the injection of gases such as carbon dioxide, nitrogen, and lean or enriched natural gas in oil and gas condensate reservoirs. EOS do not usually predict phase and volumetric behavior of reservoir mixtures accurately, thereby requiring adjustment of component properties to match experimental PVT data. The following list of PVT properties provides useful reviews of property correlations for oil and gas.
| Pseudocritical Properties | Effective empirical values for the critical properties (pressure, volume and temperature) of a multi component chemical system. Both pseudocritical temperature and pressure are required for many gas calculations. If the gas specific gravity is known, one can use correlations for estimating these parameters whenever field or laboratory measurements are unavailable. |
| Z Factor | A natural gas compressibility factor is required for calculating gas volume, density, and viscosity at elevated pressures and temperatures. After obtaining these values, one can determine such quantities as gas reserves, pressure drop of gas flow through pipe, static pressure gradients in gas wells, and production rates. |
| Bubblepoint Pressure | The pressure and temperature conditions at which the first bubble of gas comes out of solution in oil. Often the oil is saturated with gas when discovered, meaning that the oil is holding all the gas it can at the reservoir temperature and pressure, and that it is at its bubblepoint, the pressure at which the first gas begins to evolve from the oil is defined as the bubblepoint. |
| Solution GOR | The solution gas-oil ratio (GOR) is a general term for?the amount of gas dissolved in the oil. Heavy oils (lower API gravity) have lower capacity to?contain dissolved gas than lighter oils. Solution GOR in black oil systems?typically range from 0 to approximately 2000 scf / bbl. For most purposes, the solution GOR at the bubblepoint is the value of interest. At pressures above the bubble point pressure the oil is said to be undersaturated.??Below the bubblepoint pressure, the gas begins to come out of solution and form a?free gas phase, and the oil is said to be saturated. |
| Bubblepoint FVF | The ratio of a phase volume (water, oil, gas, or gas plus oil) at reservoir conditions, relative to the volume of a surface phase (water, oil, or gas) at standard conditions resulting when the reservoir material is brought to the surface. Denoted mathematically as Bw(bbl/STB), B0 (bbl/STB), Bg (ft3/SCF), and Bt (bbl/STB). |
| Isothermal Compressibility | The isothermal gas compressibility, is a useful concept that is used extensively in determining the compressible properties of the reservoir. The isothermal compressibility is also the reciprocal of the bulk modulus of elasticity. |
| Viscosity | A quantity expressing the magnitude of internal friction, as measured by the force per unit area resisting a flow in which parallel layers unit distance apart has unit speed relative to one another. |
| K Values | K-value or k value may refer to: Thermal conductivity. The force constant of a spring, see Hooke's law. Vapor–liquid equilibrium, the ratio of vapor concentration to liquid concentration at equilibrium. |
| Interfacial Tension | Interfacial tension is the force that holds the surface of a particular phase together and is normally measured in dynes/cm. The surface tension between gas and crude oil ranges from near zero to approximately 34 dynes/cm. |
| Diffusion Coefficients | Diffusivity or diffusion coefficient is a proportionality constant between the molar flux due to molecular diffusion and the gradient in the concentration of the species (or the driving force for diffusion). Diffusivity is encountered in Fick's law and numerous other equations of physical chemistry. |
PVT Experiments
The standard PVT experiments include compositional gas chromatography (GC) analysis through helptanes plus (C7+), constant composition expansion, differential liberation expansion, constant volume depletion and multistage separation. Other PVT measurement include true boiling point (TBP) distillation of the C7+ material and multi contact gas injection experiments. The following summarizes these experiments indicating whenthey are performed and on which type of reservoir fluids
- Oil – Standard laboratory analysis include Bottom hole sample, Constant composition expansion, Multistage surface separation and Differential liberation. The other analysis those can be done are Recombined composition, C7+ TBP and simulated distillation, Constant volume depletion and Multicontact gas injection.
- Condensates – Standard laboratory analysis include Recombined composition, Constant composition expansion and Constant volume depletion. The other analysis those can be done for condensate are Bottom hole sample, Multistage surface separation, C7+ TBP and simulated distillation, and Multicontact gas injection.
Fluid Sampling
The key objective of sampling and laboratory analysis is to determine the exact nature of the reservoir fluid. It is essential to measure the properties of oil and gas fluids in the reservoir in order to facilitate the reservoir management. The main challenge in fluid sampling is that the sample remains representative during handling and storage, until all required measurements have been completed. Therefore it is essential that all the necessary precautions are taken to prevent poor samples from leading to erroneous physical property measurements. The sampling program must ensure that appropriate procedures are used to ensure that samples are taken under the best conditions.
In many cases, even good fluid samples may be studied under invalid conditions. Pressure and temperature errors can influence measurements and their interpretation, but it is especially errors in gas/oil ratio (GOR) that can have a major influence on a PVT study. Even basic data, such as sampling date and time, if not recorded or erroneous, can reduce the value of samples, even to the point of making measurements meaningless. For more details on Fluids Sampling please visit Petro-Wiki
Image source: Petro-Wiki
Source Info: Wiki AAPG / Petro-Wiki